From Sign-Up to Stickiness: How I Boosted Engagement for Benefed.gov’s Insurance tool.
At FedPoint, it started with solving accessibility challenges to enhance how federal civilians shop their benefit plans on BENEFEDS.gov. Collaborating with Ella Manzelli, I conducted mixed-methods research, identified user pain points, and applied a structured design thinking process to deliver a solution that improves onboarding, plan selection, and enrollment.
Through in-depth brainstorming sessions with Andrew Zarbo & James Roth, we successfully secured buy-in from the stakeholders.
Certain details about this project are confidential. This is a project showcasing my work process and the steps I follow to reach impactful solutions in the industry.
My Contributions
User Interviews,
Heuristic Evaluation,
WCAG 2.2 Accessibility Checks,
Persona Identification,
Wireframing & Figma Make Prototyping,
Stakeholder Meetings.
UX KPIs
Content-to-Chrome Ratio,
Interaction Costs,
Time on Task.
Business KPI
Enrollment Rate,
Customer Satisfaction Index.
Timeframe
4 Months,
Summer 2025.
My Role & Location
UX Specialist
Fedpoint, Portsmouth, NH.
1. The Challenge.
Older federal employees often face difficulties in exploring benefits online at BENEFEDS.gov, resulting in frequent calls to customer service and underutilization of the portal.
2. Research.
Target audience & their Behavioral Patterns
Target Persona: Federal Employee
Avg. age: 40+
I invested considerable time in identifying the online behavior patterns for the older audience. Focusing on how they allocate their cognitive resources to scan, process, and absorb the information available on the web. I studied research articles to understand the accessibility and usability considerations guiding the behavioral patterns. Two articles that helped me out the most were,
1. Usability for Older Adults - NNGroup.com
2. Middle-Aged Users’ Declining Web Performance - NNGroup.com
My key takeaways from the study are as follows:
1. Decline in cognitive resources
Research indicates that usability performance decreases by approximately 0.8% per year between ages 25 and 60, reflecting slower information processing and reduced working memory among older adults.
2. Require clearer navigation patterns and interfaces
Middle‑aged users spend 0.5% more time per page and visit 0.3% more pages per task, highlighting the need for streamlined, intuitive navigation that reduces cognitive effort and supports efficient information discovery.
3. Accessible Design Gains
Optimizing usability & accessibility can improve task success rates by up to 25% and reduce error rates by 30%, creating a digital environment that’s not only reliable and intuitive but also instills confidence, comfort, and trust.
2.1. Qualitative Research
Observational insights
With qualitative research methods, I gathered observational insights on why users struggle with the existing solution and how they accomplish the goals in the current scenario. While researching, I conducted moderated user interviews, analyzed the existing proxy interview data, and studied the persona demographic details. It helped me build the target persona of the user we cater to. In this case, one major persona attribute was the age.
Methods
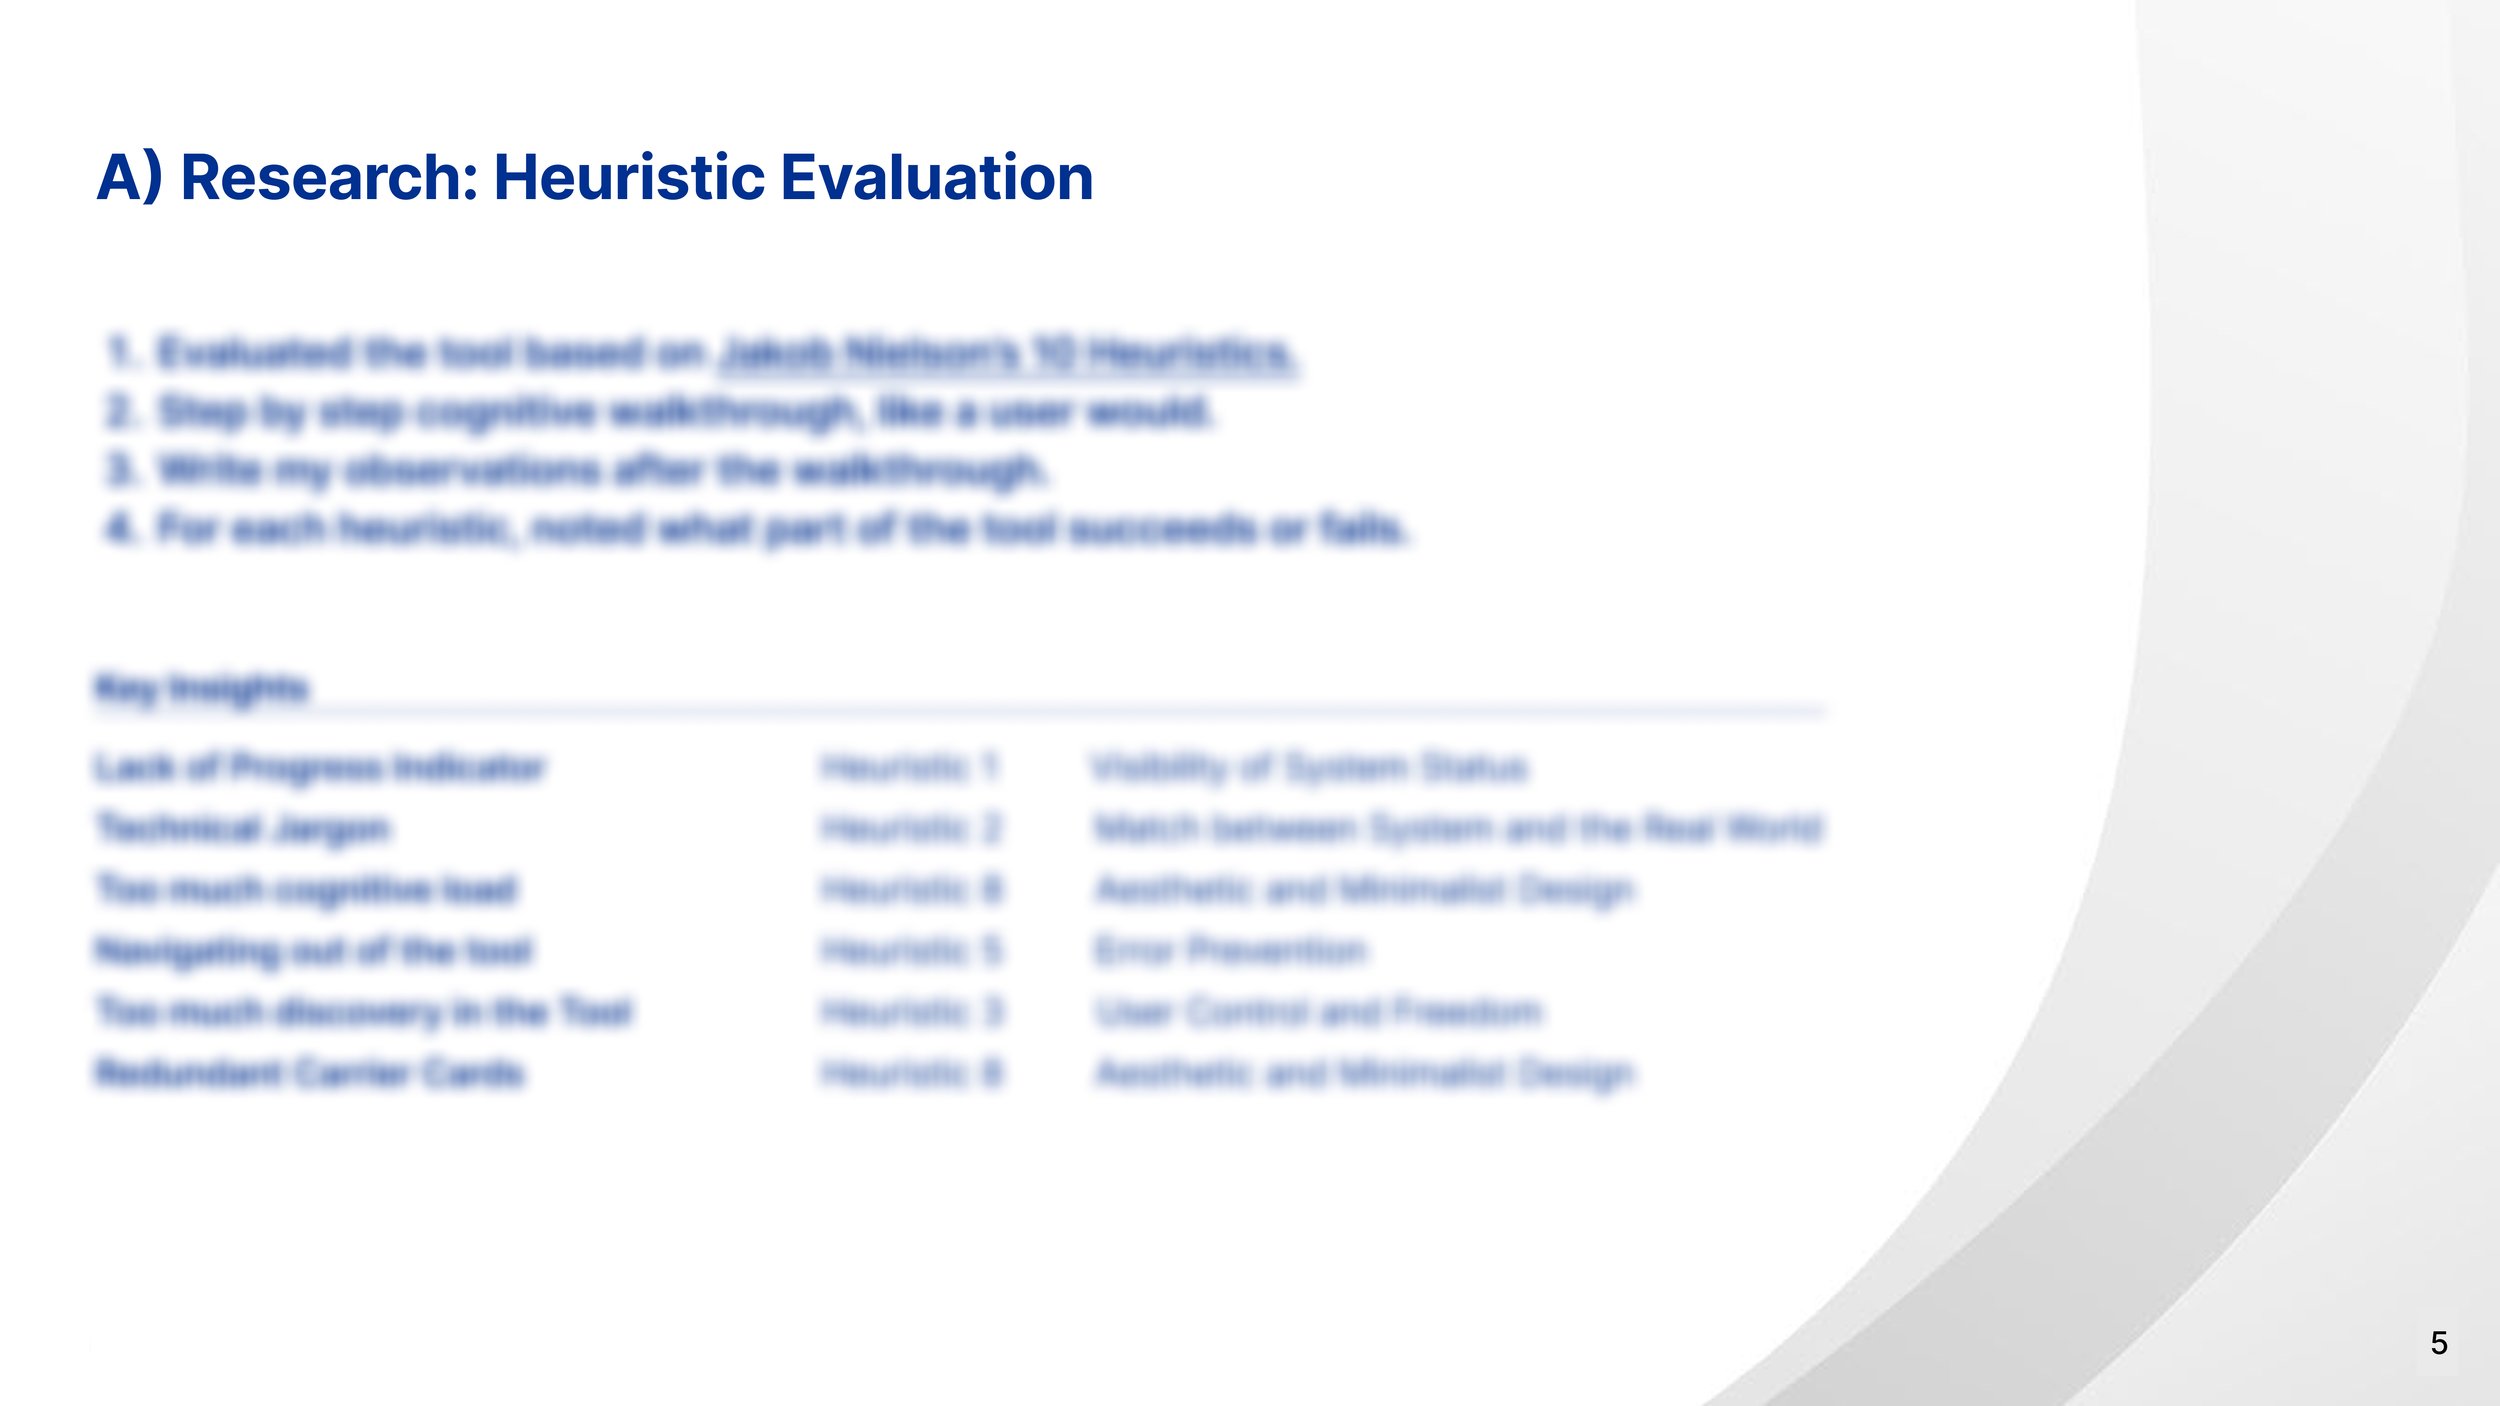
a) Heuristic Evaluation
b) Proxy Interviews
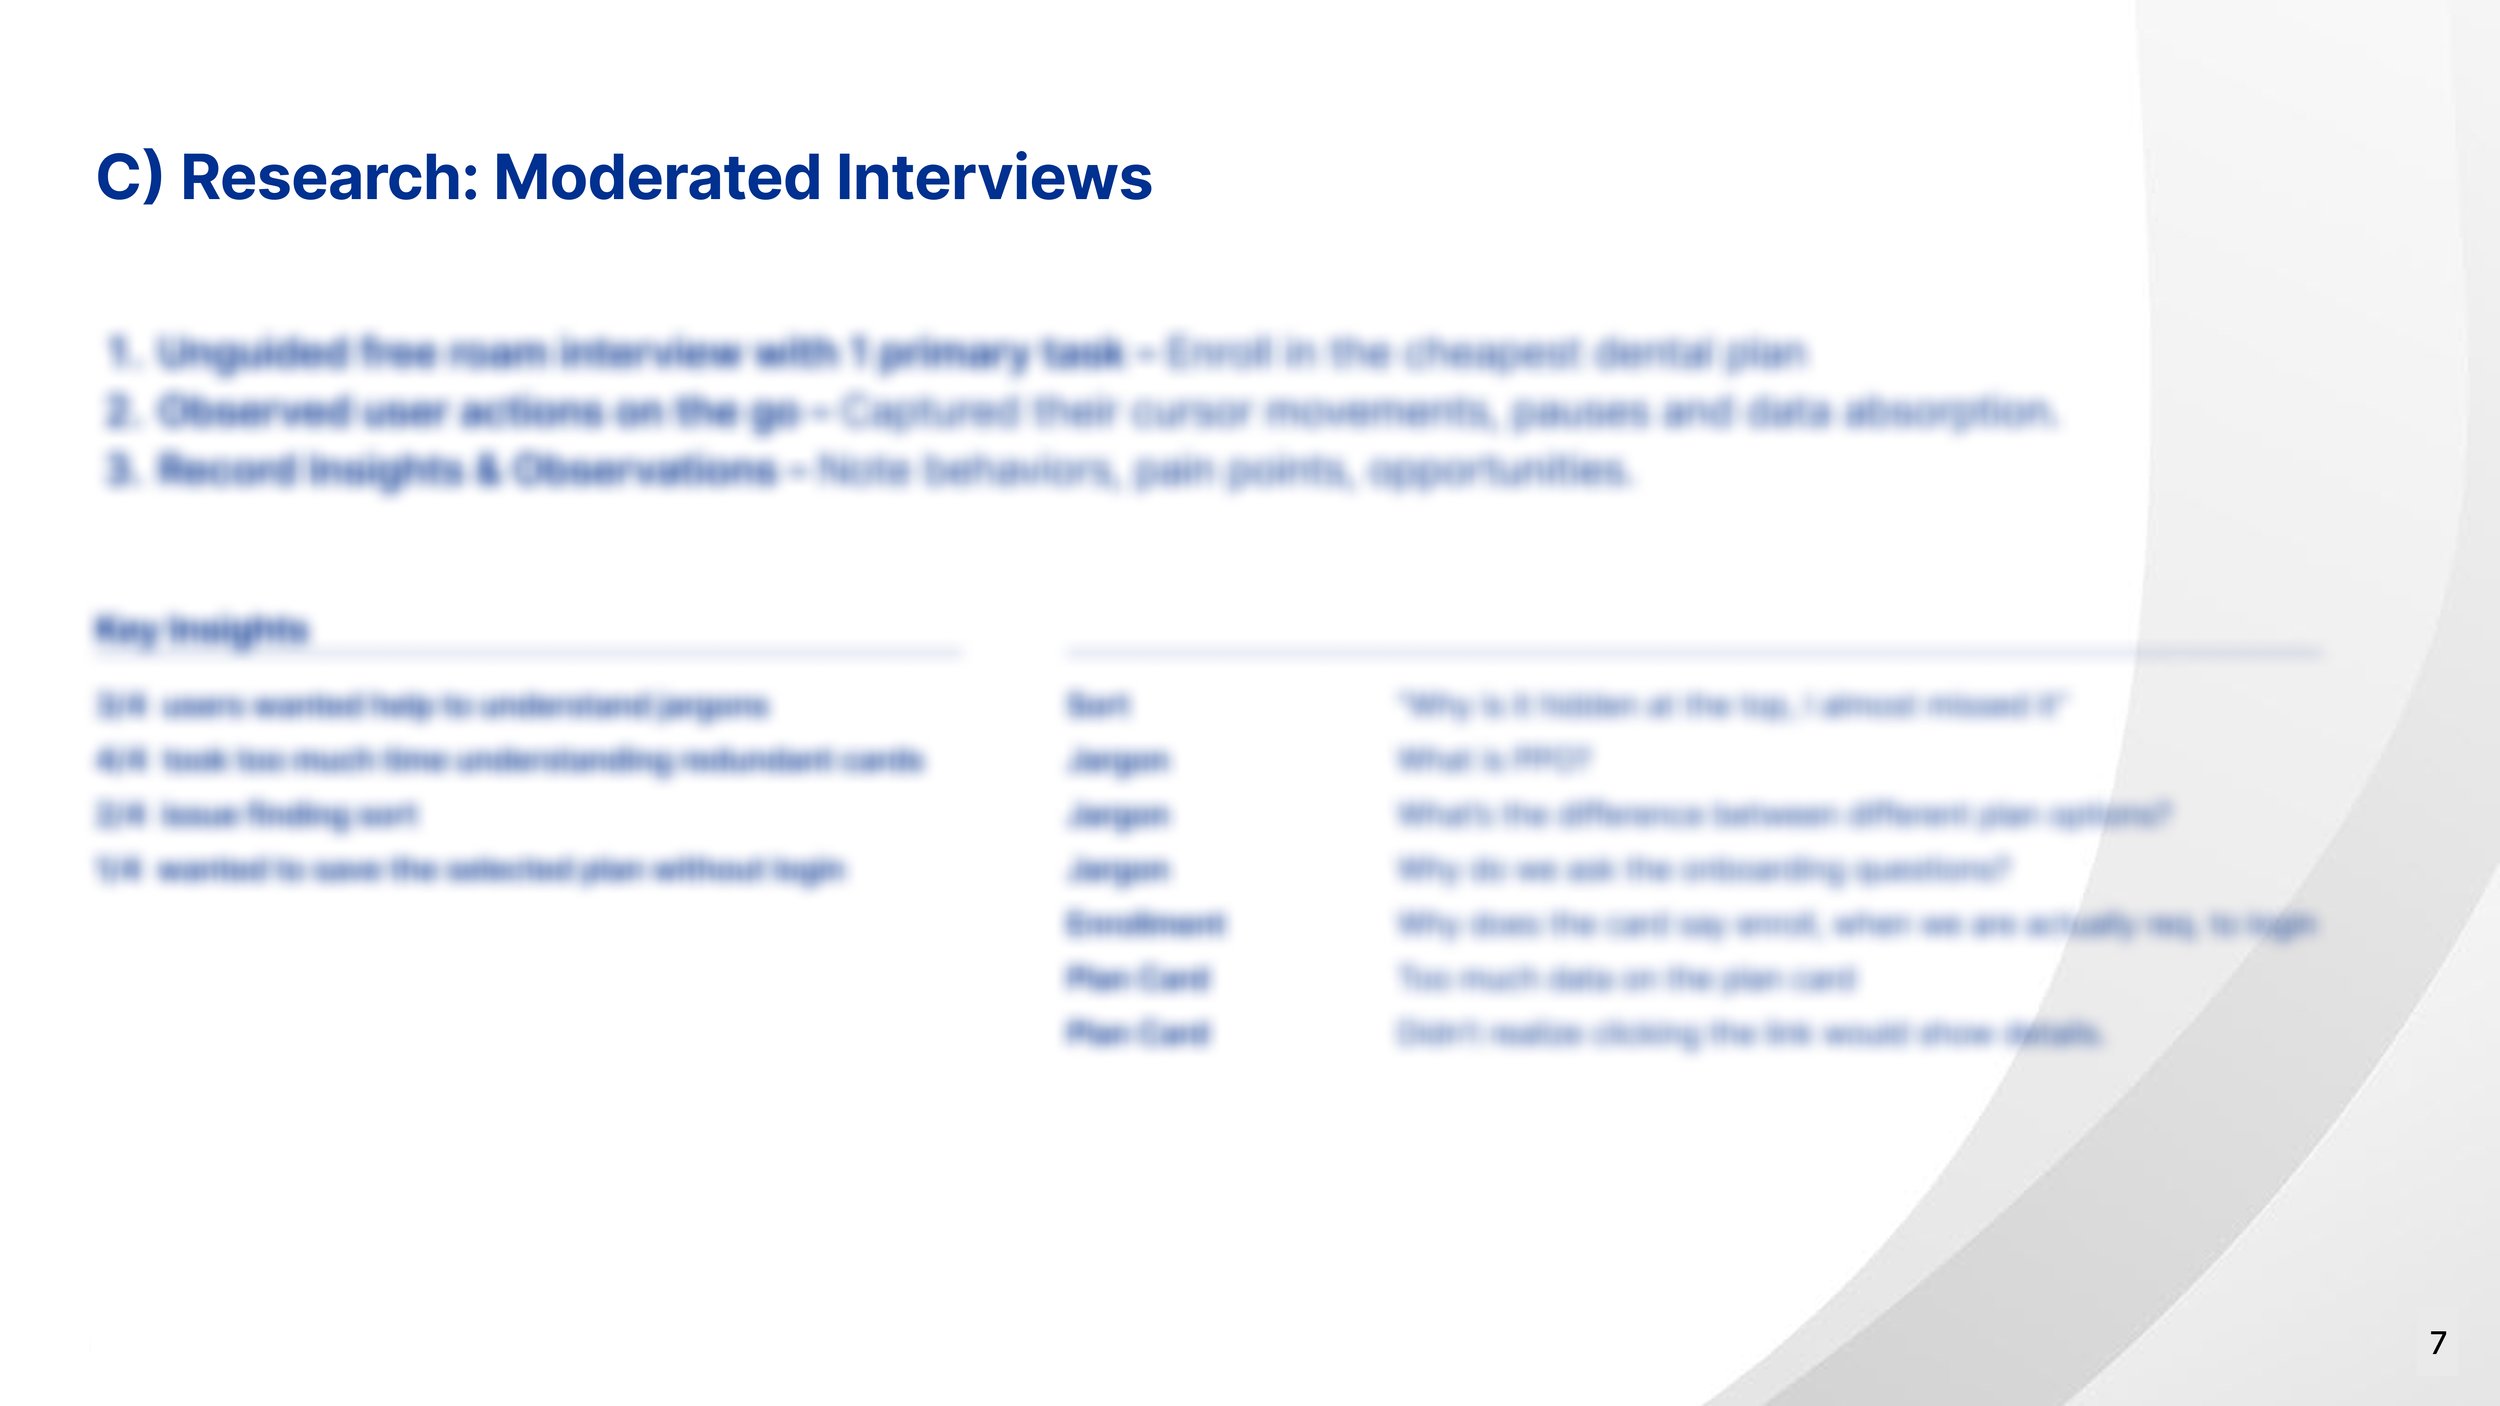
c) Moderated Interviews
d) Persona Analysis
To learn more about my research process, connect with me.


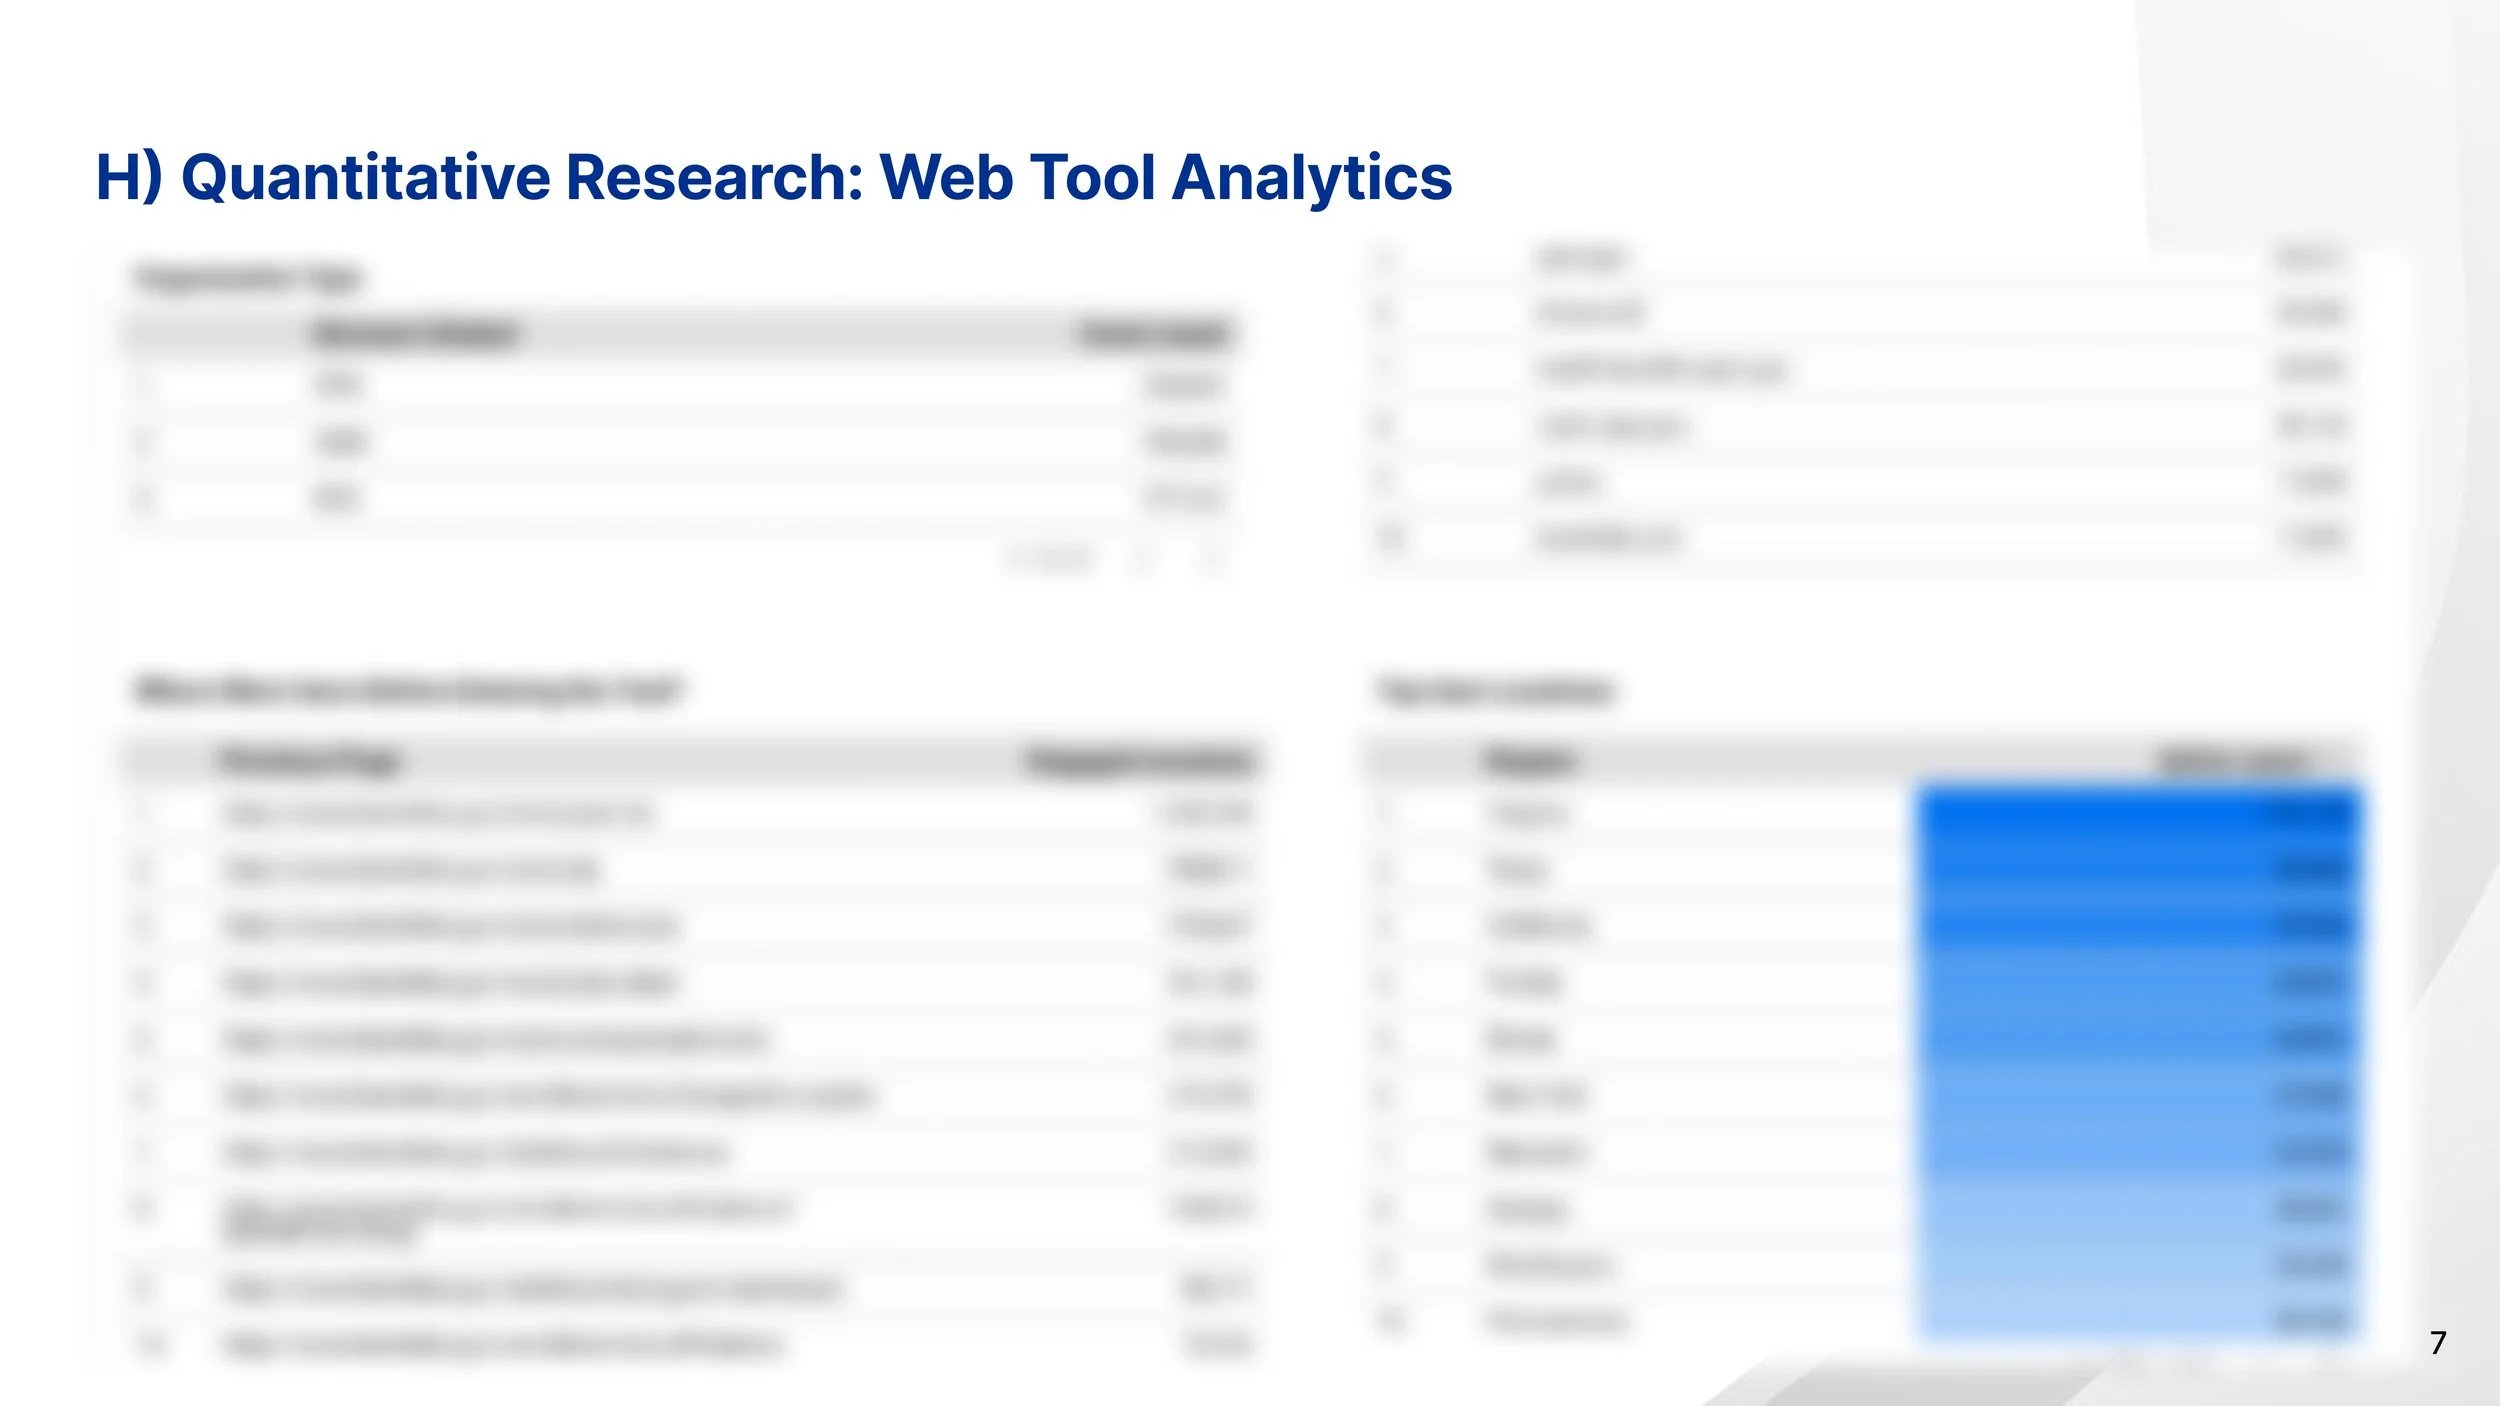
2.2. Quantitative Research.
Extracting Numbers.
Organizing tool’s performance metrics and user analytics on a dashboard made in Looker Studio, data fed from on Google Analytics, gave me quantitative numbers. Numbers that helped me give direction to the project and understand what success would look like, and what seems important from a business perspective.
Performance Indicators,
g) User-specific Analytics
h) Web Tool Performance
To learn more about my research process, connect with me.
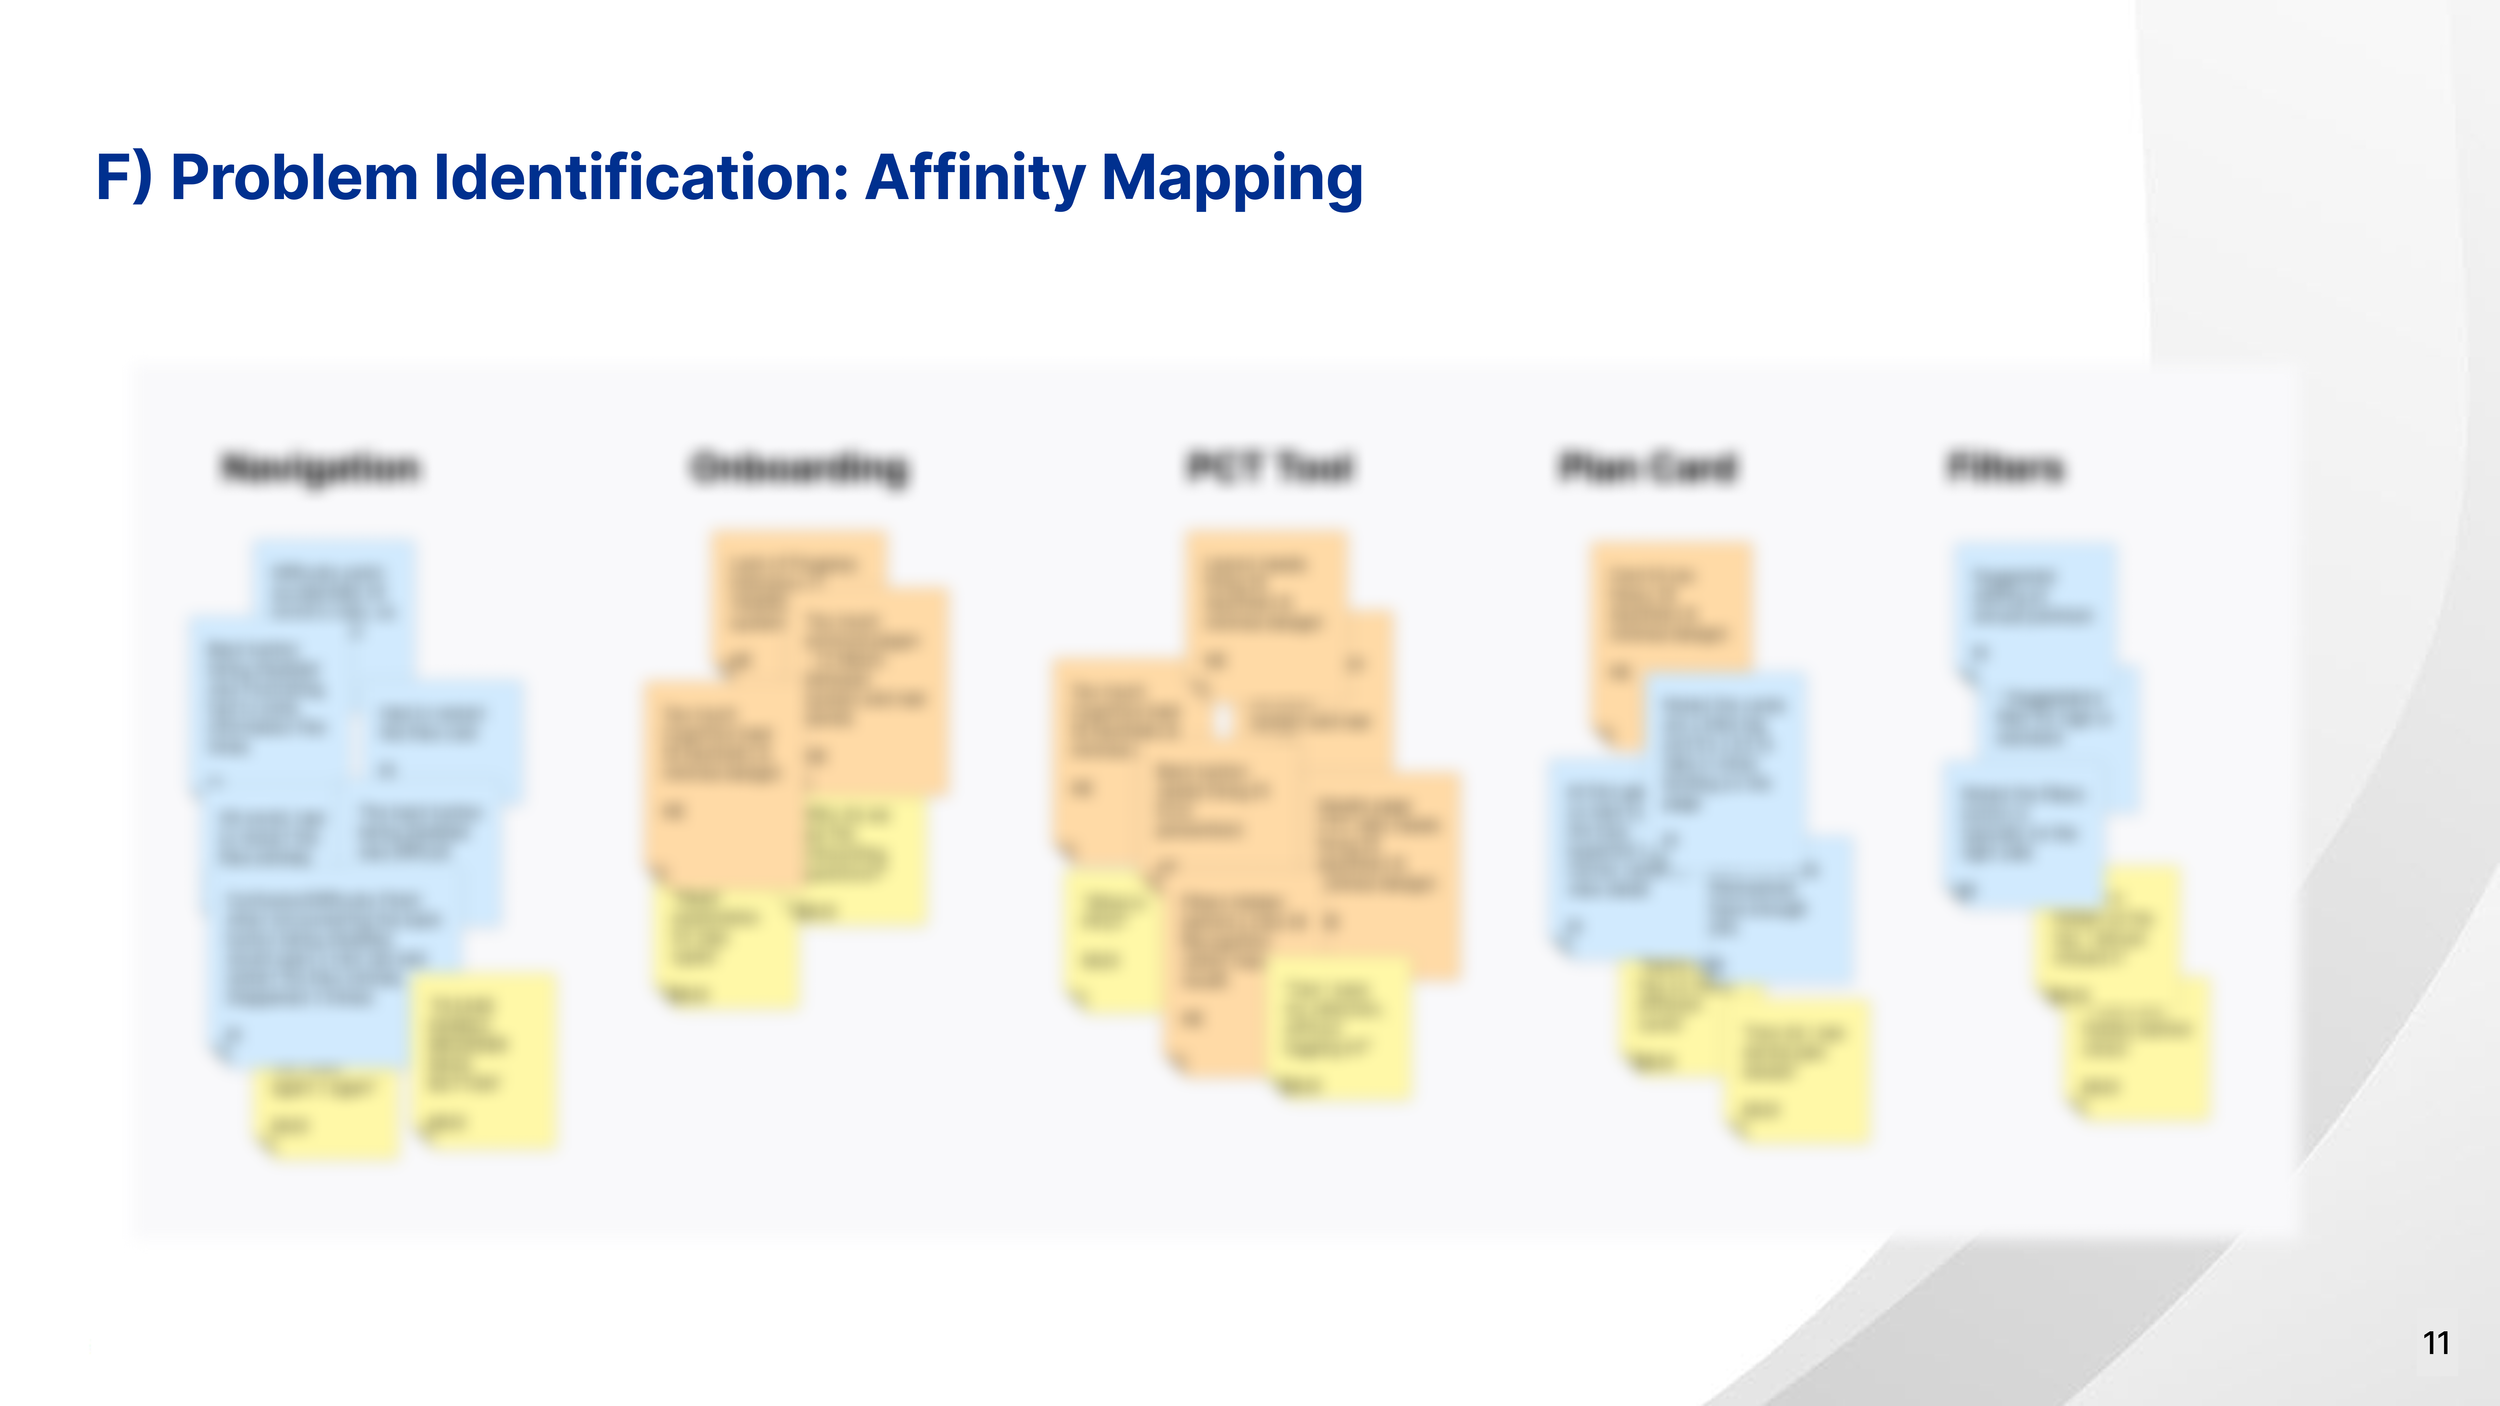
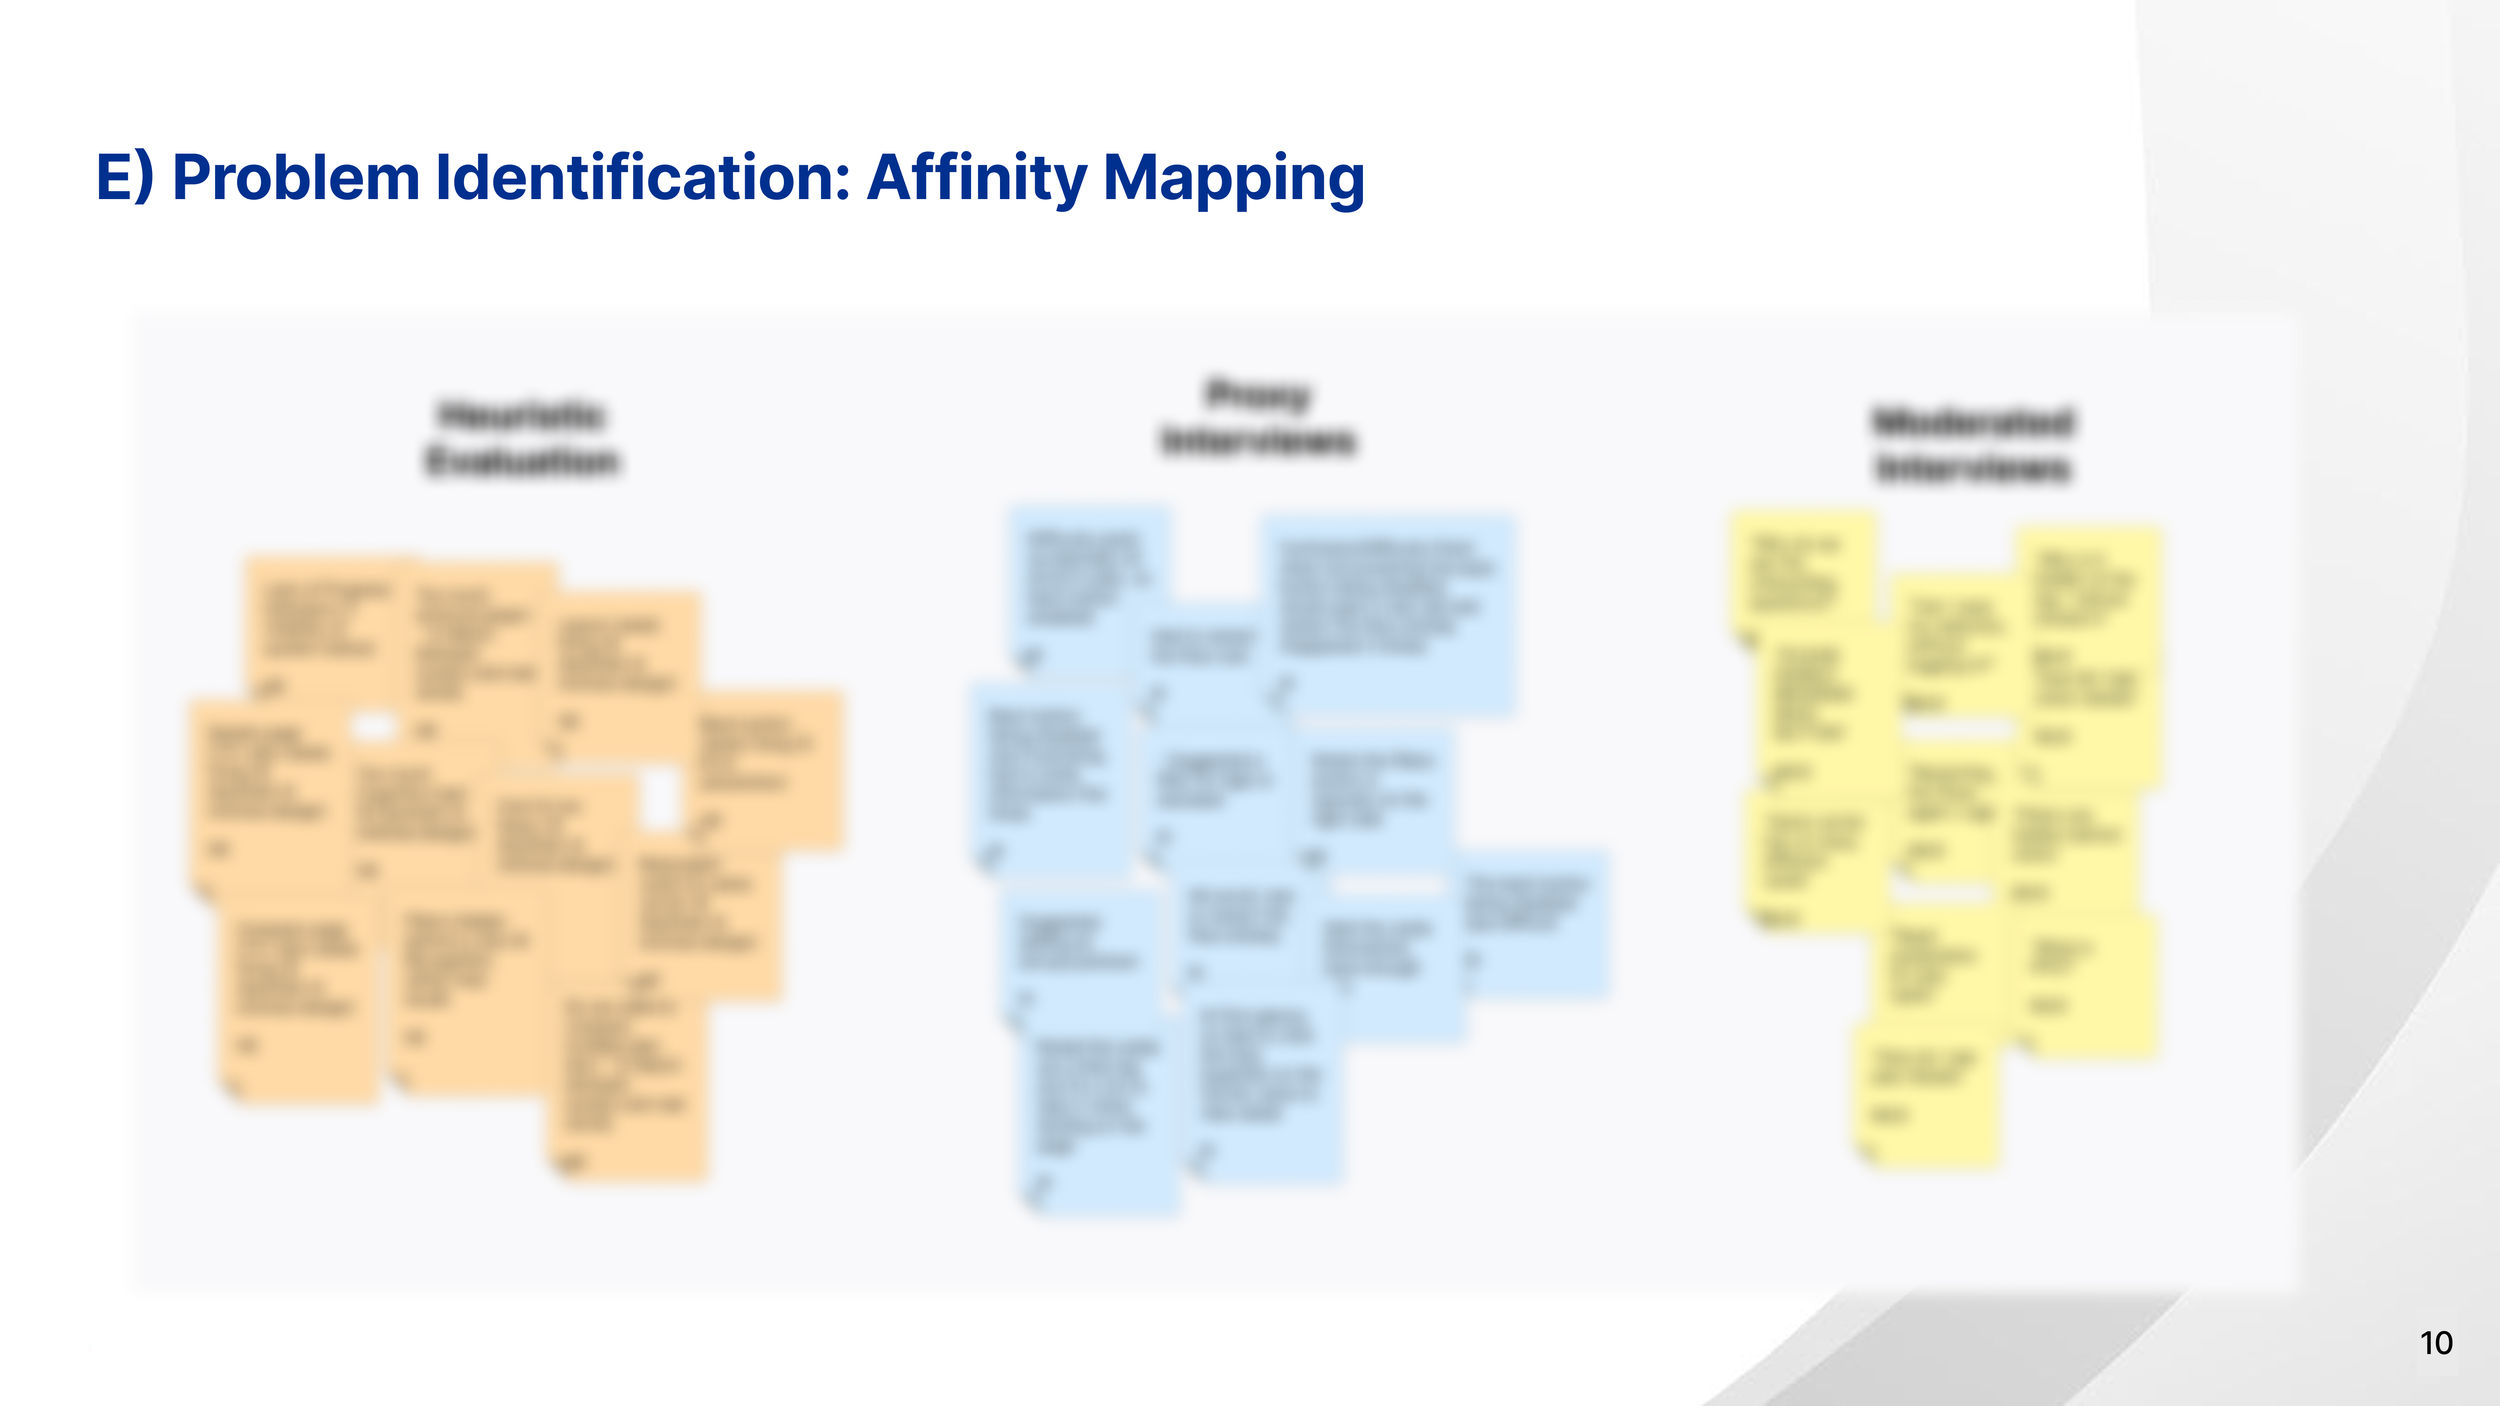
2. Problem Identification.
(HMW)
How could we ease the insurance-buying experience of an elderly civilian while retaining the trust within the federal administration?
Once the core problem was well understood, and the target user persona had been established, I re-organized the research data via affinity mapping. Insights were organized into meaningful categories, which helped me identify key pain points, emerging patterns and what needs major attention.
To learn more about my RCA process, connect.
3. Brainstorming
I started from the root cause, the very first user touchpoint, and created flowcharts to visualize and understand the IA, the current flow of information, mapping to how the persona described they used the portal.
When I had the existing process flowchart, the next step was to improve it, minimizing the interaction cost, as I studied NNG articles, and from my understanding of the age group I was designing for, cognitive resources saved at one step could be used at another. So my goal was to help the users make decisions quickly without exhausting their cognitive resources during the initial steps of the portal.
To learn more about my brainstorming process, connect.
4. Solutioning
In the solutioning stage, I indulge in 7 phases of design where I work on individual modules of the portal and work my way up to the most optimized solution, keeping WCAG 2.2 and 508 Compliance guidelines in mind for accessibility and usability. Every phase involves signing off on a module, and while I work on the smaller bits and pieces, the overall picture gets painted with absolute perfection.
To learn more about my design process, connect.

5. Usability Testing & Dev-handoff plan
Towards the end of the project, I set directions to test the solution via usability testing methods - moderated sessions and A/B testing within a focused group. For this, I prepared the working model of the solution on Figma Make.
To me, understanding how a solution will be implemented within existing development resources, limitations, and bandwidth is just as critical as translating the written requirements into a functional prototype. Which is why I created an Impact–Effort Matrix to evaluate, break down, and prioritize my solution into smaller sprint-digestible projects, and assign them to Big Bets, Quick Wins, Fill-Ins, and Time Wasters.
To learn more about my testing process and dev-handoff process, connect.

Certain details about this project are confidential. This is a project to showcase my work process and the steps I follow to reach impactful solutions in the industry.
As the primary contributor and lead in this project, I’ve outlined my work process and responsibilities. To talk more about the process and the resulting business impact, please connect.
Team Feedback
“His collaboration skills and positive attitude made him a valued partner across disciplines, and his influence continues to shape our design processes even after his departure. Any organization would be fortunate to have Harshveen.”
James Roth, Team Lead Digital Platforms, Fedpoint
“He came into the position with a wealth of knowledge and an eagerness to dive right into what is very complex work. His ability to learn and fully understand what the problem is, and then use his extensive background, expertise, and research/analytical/iterative skills to craft just the right solution was apparent within just a few weeks on the job.”
Andrew Zarbo, UX Lead, Fedpoint.
Other projects at FedPoint USA
-
![]()
Building FedPoint’s USWDS-based Design System from the ground up on Figma. (Atomic Structure + Tokens/Variables setup + Defining 15+ Components)
-
![]()
Optimized the compare tool, improving usability i.e Chrome-to-content ratio from 63.93/33.89 to 46.04/53.95.
-
![]()
Re-structuring the business portal for the operations team (FMP+DQA) addressing insights from user interviews.